tmapper (Python)
tmapper is a Python port of Temporal Mapper 2, a toolbox that turns time-series data into an attractor transition network — a compact graph that captures the stable states of a dynamical system and the transitions between them, using nothing but the time series itself.
It generalizes the original, fMRI-specific Temporal Mapper into a general-purpose tool for characterizing complex dynamics across disciplines and data types.
Then head to the Quickstart, or launch the point-and-click
app with tmapper-app. (The distribution is named tmapper-py;
it imports as import tmapper — see Installation.)
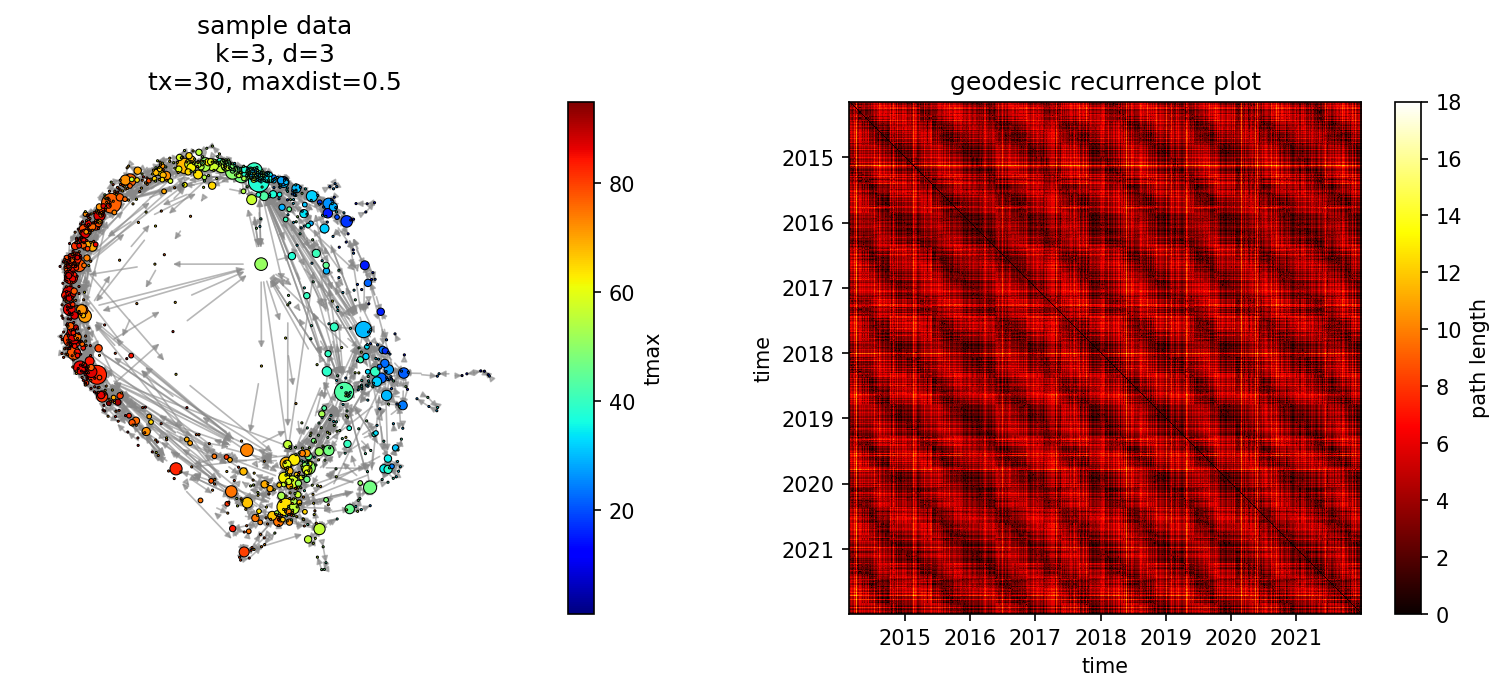
An attractor transition network built by tmapper from historical East Lansing weather data. You will reproduce this figure in the Quickstart.
Coming from the MATLAB toolbox?
This is a from-scratch Python port, not a wrapper. See Concepts & coming from MATLAB for a function-by-function mapping and the handful of behavioral differences worth knowing about.
What it produces
Given a time series, tmapper returns a directed graph in which:
- each node is an attractor (a stable state the system settles into),
- the size of a node reflects the local stability of that attractor (how many time points collapse into it), and
- each edge is an observed transition from one attractor to another.
How it works
Under the hood the computation is a two-step pipeline:
Step 1 — spatiotemporal neighborhood graph
Starting from a pairwise distance matrix D between all time points,
tknndigraph builds a directed k-nearest-neighbor
graph with one node per time point, adding back the temporal (t → t+1)
links so the flow of time is preserved.
Step 2 — simplified transition network
filtergraph contracts time points that sit
within a distance d of each other into a single node. The connected
components become the nodes of the final attractor transition network.
Two parameters do most of the work: k (how many spatial neighbors each
time point may have) and d (the compression threshold — loops shorter
than this are absorbed into a node). The Quickstart walks
through both on real data.
A secondary toolkit (cycle counting/clustering, path decomposition, modularity) is also included for probing the topology of the resulting network — see the API Reference.
Besides the static plot_tmgraph/plot_tmgraph_tcm figures, dense networks
can also be explored as a draggable/zoomable/hoverable HTML page via
plot_tmgraph_interactive — see the Quickstart.
Where to go next
- Installation — install the package and check dependencies.
- Quickstart — build your first transition network end to end, reproducing the figure above.
- Interactive App — the same pipeline point-and-click in your browser, with figure and data exports.
- Concepts & coming from MATLAB — what the nodes, edges, and loops mean, and how the Python API maps onto the MATLAB one.
- API Reference — full documentation for every function, generated from the source.
Citation
If you use this toolbox in your work, please cite:
Zhang, M., Chowdhury, S., & Saggar, M. (2023). Temporal Mapper: transition networks in simulated and real neural dynamics. Network Neuroscience, 7(2): 431–460.